Thursday, July 24, 2014
I've moved!
Rink Stats has moved! Check out www.rinkstats.com to see all my old posts, as well as any new content.
Wednesday, May 28, 2014
Corsi and Fenwick suck, or why we should be trying to do better
Check out this post on the new version of Rink Stats.
I think Corsi sucks.
I think Fenwick sucks.
I think they suck, not because I'm an old-school, Brian Burke-ian stats hater. I think they suck because when it comes to "advanced" hockey stats, the formula shots + blocks + misses = corsi is lazy and oversimplistic. I think they suck because (at best) they're weak proxies for what we believe is important in a hockey game (puck possession). I think they suck because I know we can do better.
Mostly, I think they suck because they're a constant reminder of the fact that there's so little investment in hockey analytics by teams and by the media. Don't get me wrong, there's fantastic work being done by lots of people on the blogosphere, but until NHL invests in player tracking technology (and hopefully makes it publicly available) we're going to be stuck using weak proxies like Fenwick and Corsi to measure possession.
In this post I don't intend to bring you to my side. You probably clicked on this post precisely because you know what Fenwick and Corsi are and find them valuable. I agree with you on that. They're infinitely better than plus/minus and other run-of-the-mill stats. But until we get player-tracking data and other more sophisticated stats, I think it's important that we understand how to properly use Corsi and Fenwick.
The point of this post is to convince you that Corsi and Fenwick don't do a particularly good job of predicting who will win hockey games, and they aren't any better at this task than the traditional shots-on-goal statistic. I also hope to build our understanding of the types of questions that Corsi and Fenwick can answer and when it's appropriate to use them to build narratives about games. Right now I'm mostly concerned with team-Corsi and team-Fenwick, not individual player Corsi/Fenwick, but in the future I'll hopefully dive into the value of C/F on assessing player performance.
Monday, April 14, 2014
2013/2014 win probabilities - Central Division
Check out this post on the new version of Rink Stats.
Below are the videos which show the win probability graphs for all 2013/2014 games for the teams in the Central Division. To learn more about the win probability metric, check out my post here. The folder with the individual game graphs for every team is available here.
2013/2014 win probabilities - Pacific Division
Check out this post on the new version of Rink Stats.
Below are the videos which show the win probability graphs for all 2013/2014 games for the teams in the Pacific Division. To learn more about the win probability metric, check out my post here. The folder with the individual game graphs for every team is available here.
2013/2014 win probabilities - Metropolitan Division
Check out this post on the new version of Rink Stats.
Below are the videos which show the win probability graphs for all 2013/2014 games for the teams in the Metropolitan Division. To learn more about the win probability metric, check out my post here. The folder with the individual game graphs for every team is available here.
Sunday, April 13, 2014
2013/2014 win probabilities - Atlantic Division
Check out this post on the new version of Rink Stats.
Below are the videos which show the win probability graphs for all 2013/2014 games for the teams in the Atlantic Division. To learn more about the win probability metric, check out my post here. The folder with the individual game graphs for every team is available here.
How much smarter are college basketball experts than the rest of us?
Check out this post on the new version of Rink Stats.
I wrote an article this week for Deadspin looking at how much better college basketball "experts" did at predicting the NCAA tournament this year than non-experts. I used the same 11 million brackets from ESPN.com's Tournament Challenge as I used for the earlier article in the Wall Street Journal. Perhaps unsurprisingly, the experts didn't do all that much better than the non-experts.
I've also made the data available here.
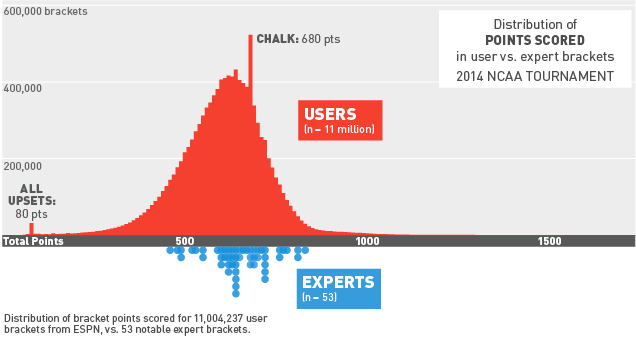
"Generally the experts' brackets were slightly better than the non-expert ones, although the evidence isn't especially overwhelming. The analysis suggests that next year you'll have just as good a chance of winning your office pool if you make your own picks as if you follow the experts."
I've also made the data available here.
Tuesday, April 8, 2014
Odds of a perfect NCAA bracket this year
Check out this post on the new version of Rink Stats.
Check out my new, non-hockey, article in Monday's Wall Street Journal. I find that, this year, there was a 1 in 1.47 quadrillion chance of picking a perfect NCAA March Madness bracket.

Tuesday, March 25, 2014
A stats-driven power ranking
Check out this post on the new version of Rink Stats.
I used the win probability metric, which I described here, to calculate the average probability that each team wins each of their games. Then, for each team, I calculate a weighted-average (based on the logged temporal distance) of their win probabilities. In other words, the most recent game gets the highest weight, while game 1 is still in the calculation, but significantly down-weighted.
The result is a new power ranking metric, which is entirely based on in-game statistics. As far as I know (and please correct me if I'm wrong) but it's also the first power ranking (in any sport?) which doesn't just provide the ranks of the teams (1 through 30) but gives a sense of how big the gaps are between teams 1 and 2, 2 and 3, etc. Check out the results below, which are based on every game this season (excluding last night's).
As you can see, not only is Boston the top-ranked team, it's doing significantly better than the other teams in the top 5, mostly because of their dominance during their 12 game win streak. And you can see there's a huge dropoff in teams 25-30.
Monday, March 24, 2014
Win probabilities metric 1.0
Check out this post on the new version of Rink Stats.
In the past few years, in-game win probability metrics have become increasingly common in the NFL, MLB, and NBA. Similar analytics for the NHL, however, have lagged behind. In this post I'll present version 1.0 of my NHL win probabilities metric.
So far, the metric is based on home ice advantage, score differential, and penalty time. The model is flexible enough, though, in include other factors like puck possession or (hopefully eventually) players-on-ice.
I'll assume that most people won't be interested in the statistical underpinnings, so I'll leave that for the end of the post and start by presenting some examples of the model applied to a recent games. Also, I've got some cool ideas of things I can do with this metric, but I'd love to hear any feedback you have. Plus, I'm still trying to think of a catchy name for the stat, so if you have any ideas let me know.
Friday, March 14, 2014
Win probabilities
Check out this post on the new version of Rink Stats.
I started working today on a new project. I'm trying to build a dataset that allows somebody to get the probability of a team winning a game, given the current score, time remaining, PP situation, and other variables. So far I've built the score and time remaining into my model, although hopefully in the next few days I'll add PP/SH info.
I also am trying to find a nice looking way to present the results. Below is what I have so far. This is the win probability from the exciting game 6 of the Stanley Cup Finals last year, in which Chicago trailed by a goal with less than 2 minutes left and ended up winning the game in regulation.
I'd love anybody's feedback (via email, Twitter, Facebook, wherever) on where you think I should go with this or how I can make the graphs look nicer.

In a crazy twist, it looks like Extra Skater has rolled out a similar metric today as well. I think mine looks fancier though.
I also am trying to find a nice looking way to present the results. Below is what I have so far. This is the win probability from the exciting game 6 of the Stanley Cup Finals last year, in which Chicago trailed by a goal with less than 2 minutes left and ended up winning the game in regulation.
I'd love anybody's feedback (via email, Twitter, Facebook, wherever) on where you think I should go with this or how I can make the graphs look nicer.
In a crazy twist, it looks like Extra Skater has rolled out a similar metric today as well. I think mine looks fancier though.
Thursday, March 13, 2014
How The Long-Change OT Could Cut NHL Shootouts By A Third
Check out this post on the new version of Rink Stats.
I just wrote my first article for Deadspin. A hot topic in the NHL community this week has been the possibility of tweaking the overtime rules to generate more goals and fewer shootouts. In the article, which is a followup to an article I wrote here a few months back, I look at the potential consequences of one of the proposed rules changes. I find that having the teams switch sides in OT, so that all 5 minutes are played with the long-change could drop the number of shootouts by a third.
A snippet:
A snippet:
"...we should expect that 34.29 percent of the games that go to a shootout under the current rules would instead be resolved by a game-winning goal in overtime (plus/minus 3.45 percent). In other words, if the NHL GMs adopt the proposal to make regular season overtimes use the long change, the number of shootouts in the 1,230 game season would drop from about 166 (13.5 percent of games) to about 109 (8.87 percent)."
Thursday, February 6, 2014
2014 Sochi Olympics: Why Canada Will Rule (Again) in Hockey
Check out this post on the new version of Rink Stats.
A friend of mine from grad school recently got me connected with a buddy of his who writes for the Wall Street Journal. I just wrote my first article for their regular feature The Count. I look at how much NHL Olympians are paid and how this can help us predict who will win gold in Sochi. Check it out here
Here's a snippet:
A huge chunk of that money is being paid to the 50 players on the two North American teams. The Canadian team, led by Sidney Crosby, makes a combined $157 million in the NHL, up from $126 million in the 2010 Vancouver Olympics, when host Canada won the gold. The NHLers on the U.S. team earn $127 million, up from $83 million in 2010. At the other end of the spectrum is Norway, which features just one NHL player: Mats Zuccarello, who makes $1.15 million this season for the New York Rangers.
Subscribe to:
Posts (Atom)